
Automate your energy audits
Leave the clipboard in the truck. Automate the data collection, the engineering math, and the report writing, so you can focus on the actual engineering.
Schedule a DemoCapture Data Without the Paperwork
Stop transcribing handwritten notes. Capture assets, nameplates, and photos on your phone, even when you're offline in a basement boiler room.
Explore KawiLens →Capture
Extract voltage, amps, and model numbers from photos instantly.
Tag
Link thermal images and notes directly to the specific equipment.
Sync
Keep working in dead zones. Data syncs when you reconnect.
Smart Inventory
Log equipment fast using pre-built templates
Smart Inventory
Log equipment fast using pre-built templates
Instant OCR
Auto-extract voltage and specs from nameplate photos
Photo Tagging
Link thermal images and notes directly to the asset
Offline Mode
Keep working in basements without internet access
Team Sync
See your team's progress update in real-time

Asset Inventory
Ford Dearborn Plant - Audit #248
Boiler Room
0/12 AssetsAssembly Line A
5/18 AssetsPaint Shop
8/8 AssetsHVAC System
0/15 Assets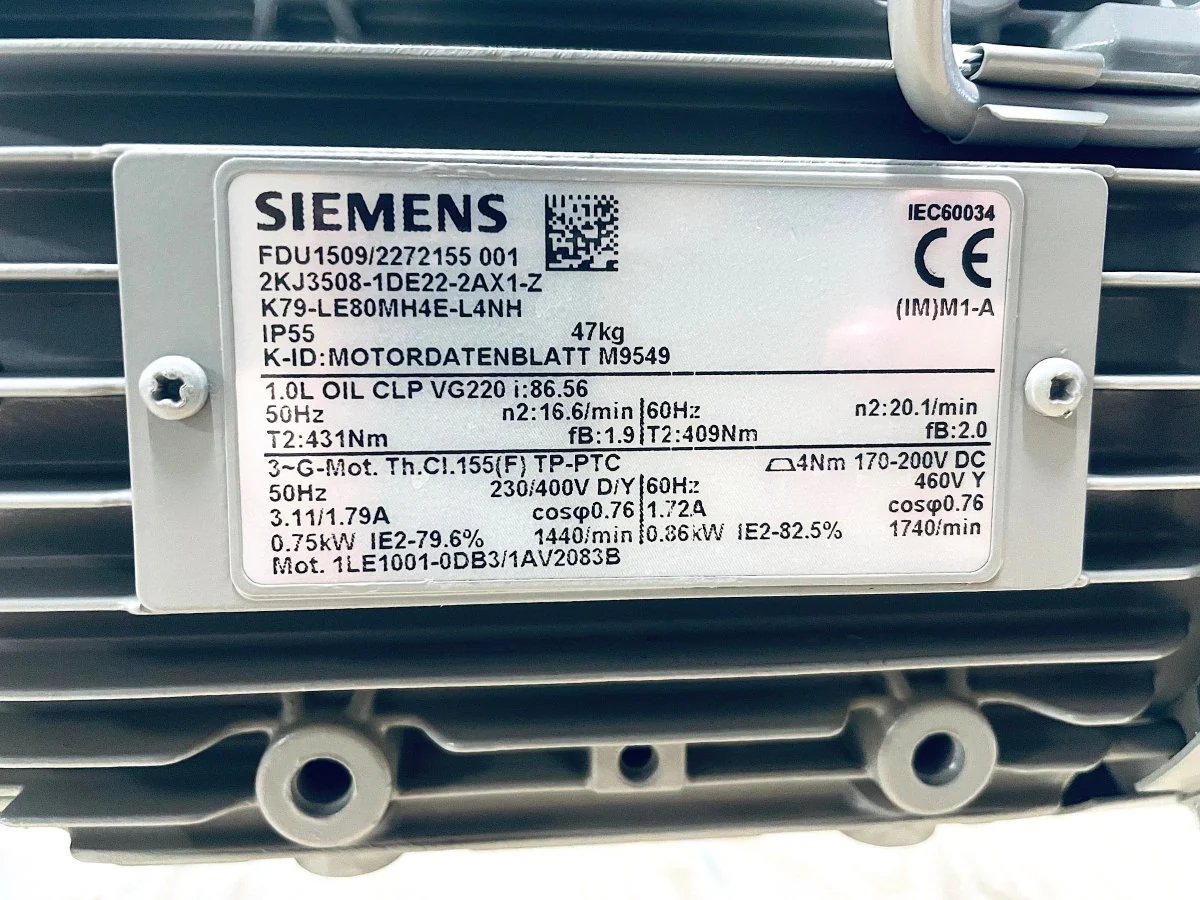
Clean Data, Fast
Upload bills. Get normalized baselines instantly.
See Baseline in Action →Upload
Drag & drop PDFs or Excel.
Extract
Auto-extract line items.
Normalize
Get regression baselines.
File Upload
Drag & drop PDFs and Excel files.
File Upload
Ready to Process
Drop files here
PDF, Excel, or CSV
National_Grid_Jan_2024.pdf
Production_Data_2024.xlsx
Weather_Nairobi_2024.csv
File Upload
Drag & drop PDFs and Excel files.
Data Extraction
Auto-extract tariffs and line items.
Variables
Map weather and production data.
Validation
Auto-detect gaps and outliers.
Final Dataset
Export clean, engineering-ready data.
Ditch the Spreadsheets
Pick a measure. We handle the math and physics.
Explore Workbench →Calculate
Physics engines for HVAC & more.
Model
Model energy flows.
Optimize
Rank by ROI and payback.
ECM Selection
Pick from 100+ standard measures.
ECM Selection
Choose a measure
VFD on Pump 3
Motors & Pumps
LED Retrofit
Lighting
Boiler Tuning
HVAC
ECM Selection
Pick from 100+ standard measures.
Configuration
Input system specs and conditions.
Calculation
Auto-calculate savings with physics engines.
Financials
Get instant ROI, payback, and NPV.
Project List
Rank projects by savings.
Generate
AI writes the summary.
Format
Auto-embed charts & tables.
Export
Export to PDF, Word, or PPT.
Template Select
Pick ASHRAE, ISO, or custom formats.
Template Select
Pick ASHRAE, ISO, or custom formats.
AI Writing
AI writes the technical narrative.
Data Tables
Embed charts and math instantly.
Review
Collaborate with inline comments.
Download
Export to PDF, Word, or PPT.
Select Template
Choose your audit standard
Energy Survey
Detailed Analysis
Energy Management
Build Your Own
Early Access Program
We are currently onboarding a limited number of auditing firms to help shape the future of Kawibot. Get full platform access and direct support from the founding team.
Custom
We'll tailor a package that fits your firm's workflow.
KawiLens
Offline data collection app
Baseline
Intelligent bill processing
Workbench
Engineering analysis suite
Reporter
Automated report generation
White-Glove Onboarding
We'll help migrate your existing Excel templates
Priority Support
Direct access to our engineering team
Questions from the Field
We know you're skeptical. Here are the answers.
Ready to modernize your audit process?
Let's TalkThe Clipboard Era is Over
You didn't get an engineering degree to format Word documents. Join the early access program and get back to the work that matters.
